Consecutive clashes: fatigue from packed fixtures tweaking spread values in leagues
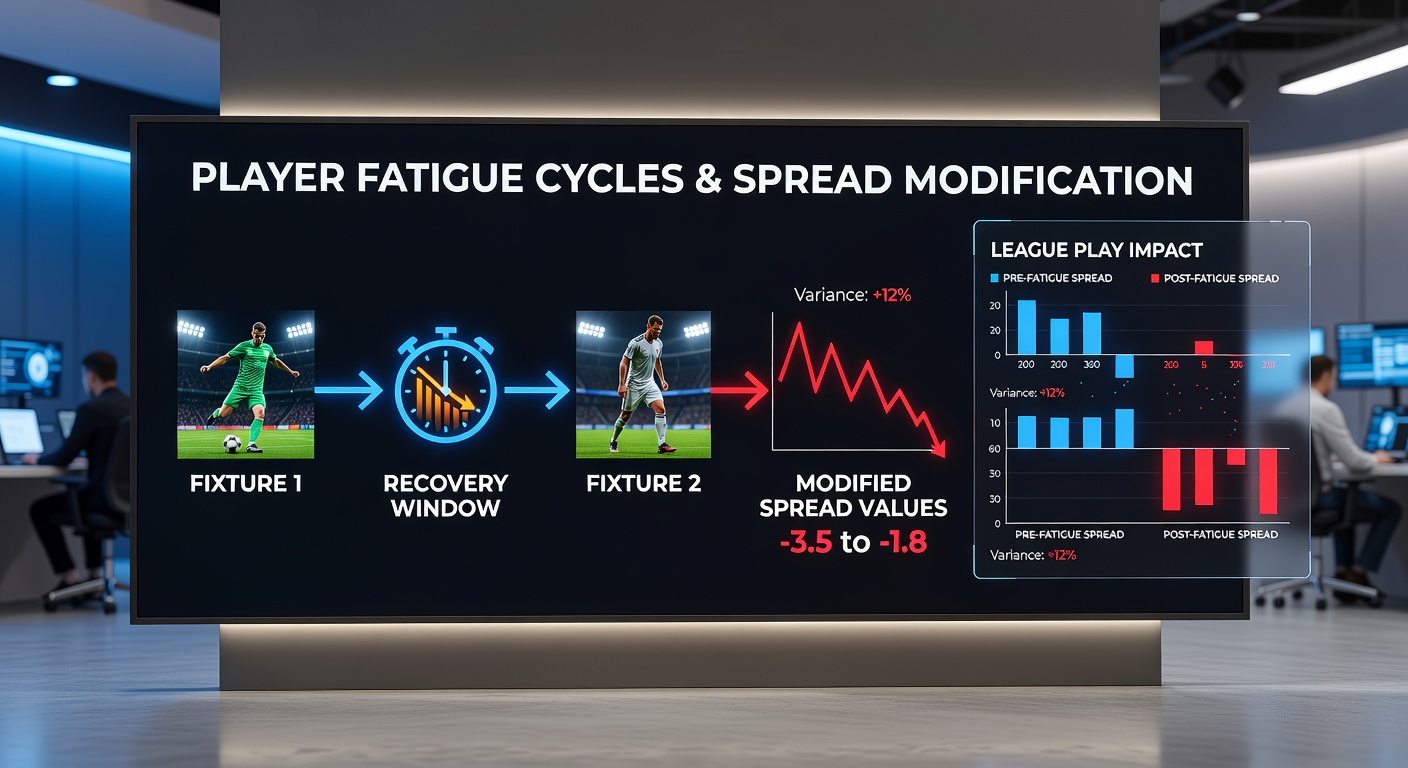
League schedules often pack multiple games into short windows, and researchers track how these sequences create measurable dips in output that betting markets adjust through spread modifications. Data from professional circuits shows that teams facing back-to-back fixtures experience average declines in shooting accuracy, defensive efficiency, and overall pace, which in turn prompts oddsmakers to recalibrate point spreads and handicap lines before tip-off.
Understanding fixture congestion patterns
Back-to-back games cluster during regular seasons across basketball, hockey, and soccer calendars, where travel demands compound physical strain; observers note that recovery windows shrink to less than twenty-four hours between contests, limiting time for muscle repair and mental reset. Studies from sports science institutes indicate that such compression elevates injury risks while lowering key performance indicators like sprint speed and reaction time, and these shifts become visible in box scores within the first quarter of follow-up matches.
Performance metrics under repeated load
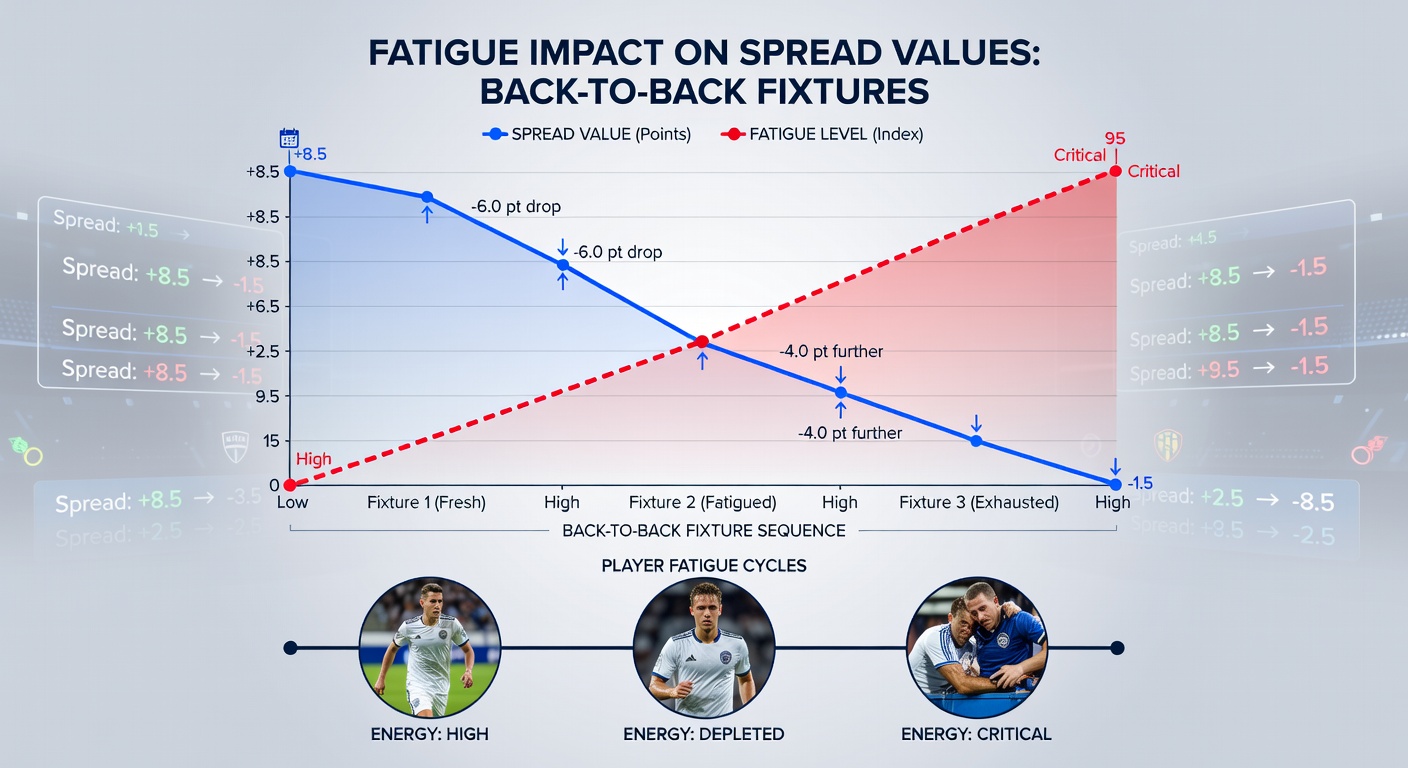
Teams playing consecutive nights post lower field goal percentages by roughly three to five points compared to rested opponents, according to aggregated league statistics through the 2025-26 campaign. Defensive rebounding rates drop similarly, while turnovers climb as fatigue accumulates, creating exploitable edges that spread setters incorporate when establishing opening lines. In European soccer leagues, for instance, squads contesting midweek and weekend fixtures exhibit reduced pass completion rates in the later stages of the second match, prompting adjustments to total goals spreads and margin-based wagers.
Market responses to observed fatigue cycles
Oddsmakers monitor historical data sets from prior congested periods and apply modifiers that widen spreads in favor of rested sides, often by two to four points in basketball contexts or half a goal in soccer equivalents. During May 2026 playoff pushes, analysts recorded several instances where back-to-back scheduling forced line movements of three points or more within twenty-four hours of release, reflecting updated projections based on player availability reports and workload tracking. External factors such as cross-country travel further amplify these effects, leading markets to price in additional variance for visiting squads.
Case examples from major leagues
One documented stretch in the NBA saw a franchise play four games in five nights, resulting in a six-point average underperformance against closing spreads; betting volumes shifted accordingly as sharp money targeted the rested opponent. Similar patterns emerged in Australian football competitions where successive fixtures altered handicap markets by consistent margins, with data from the Australian Sports Commission highlighting correlations between fixture density and reduced high-intensity running distances.
Researchers at academic centers studying workload management have published findings that link cumulative fatigue to altered tactical decisions, such as reduced pressing intensity or slower transition play, both of which directly influence over-under totals and margin spreads. These observations feed into proprietary models used by sportsbooks, where algorithms factor recent rest differentials alongside advanced metrics like player efficiency ratings adjusted for minutes played.
Data integration and line movement tracking
Betting exchanges and industry reports reveal that spread values move most dramatically in the hours after initial release when team news confirms heavy minutes logged in prior games. Figures from North American regulatory filings show increased handle on adjusted lines during peak congestion months, while European betting associations document parallel trends in soccer accumulator markets sensitive to fatigue signals. What's interesting is how early indicators like practice participation and travel logs allow markets to price these variables ahead of public awareness, maintaining equilibrium despite the underlying performance variances.
Broader implications across seasons
Longer campaigns amplify cycle effects, with mid-season tournaments and international breaks adding layers of cumulative load that influence late-season spreads. Observers note consistent patterns where squads with superior depth maintain closer adherence to projected margins, whereas thinner rosters see larger deviations once fatigue sets in. This dynamic encourages continuous monitoring of usage rates and recovery protocols, elements that data providers now incorporate into real-time analytics feeding line updates.
Conclusion
Player fatigue from back-to-back fixtures produces documented shifts in key performance areas that betting markets translate into modified spread values across league play. Statistical tracking, workload studies, and historical line movements all confirm these relationships without reliance on subjective interpretation, offering a factual basis for understanding how schedule density interacts with competitive outcomes.